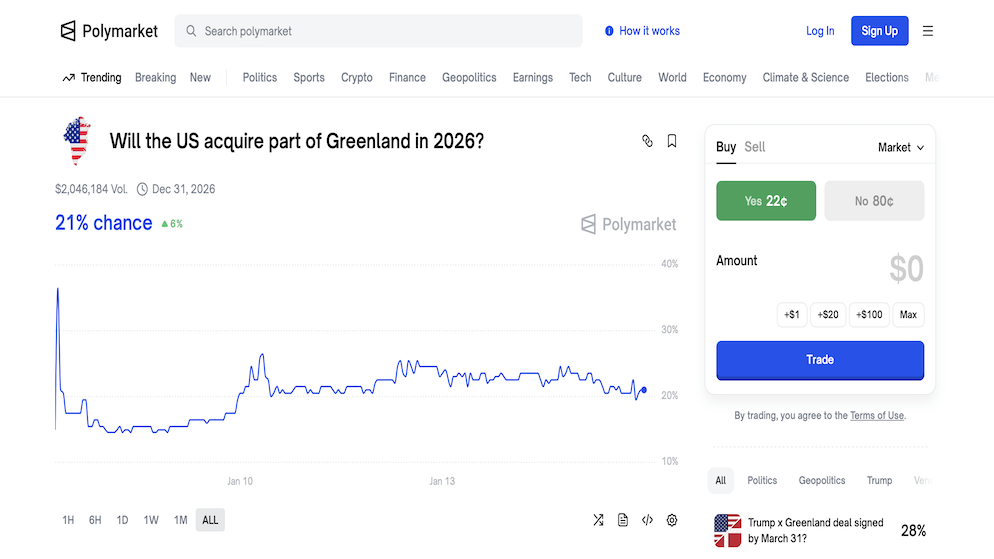
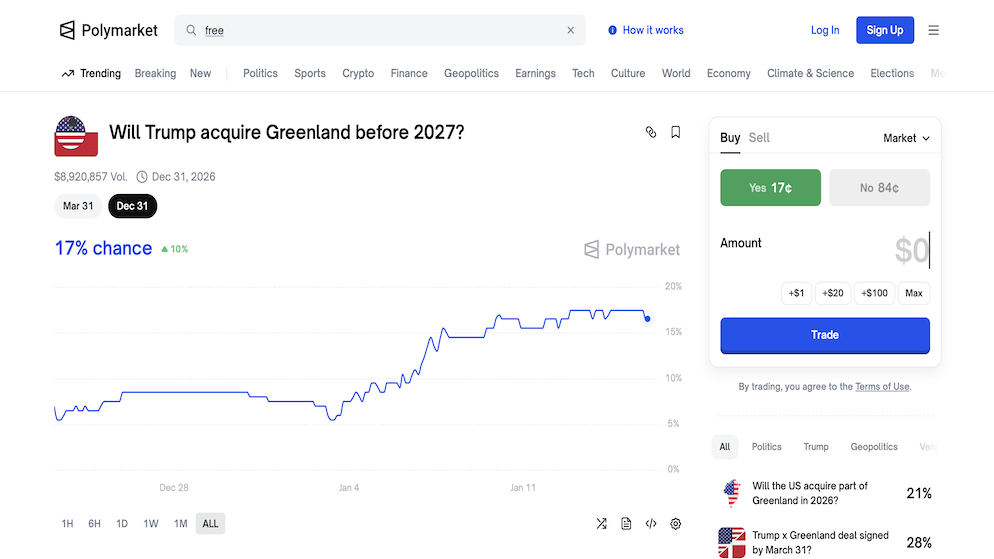
Polymarket Greenland stands as a prominent example of how geopolitical speculation is currently driving volume on decentralized prediction platforms. As of early 2026, Polymarket markets have experienced heightened activity, reflecting trader interest in the strategic relationship between the United States and the Arctic territory following recent shifts in U.S. foreign policy.
This guide provides an objective analysis of the Polymarket Greenland prediction markets, detailing the operational mechanics, the geopolitical factors influencing contract prices, and the specific data points traders utilize to assess probability. It is designed to be a neutral resource for understanding how these financial instruments function in response to real-world events.
The Mechanics of the Polymarket Greenland Trade
The Polymarket Greenland contract functions as a binary option, where the price reflects the market’s collective probability of a specific event occurring, in this case, a U.S. acquisition or military action involving Greenland. Unlike traditional equities, the value of Polymarket Greenland shares is derived strictly from the definitive resolution of the event question, typically verified by credible news sources or government communiqués.
Market participants analyzing Polymarket Greenland activity often focus on specific liquidity indicators and price movements that signal changing sentiment. When trading these contracts, several key structural elements must be considered:
- Binary Outcomes: The market resolves to “Yes” or “No,” meaning traders must hold the correct position at the time of resolution to realize a profit, or sell their position prior to resolution if the probability shifts in their favor.
- Liquidity and Slippage: Due to the niche nature of the Polymarket Greenland market, large orders can significantly impact the price, creating potential entry barriers for institutional-sized capital but offering volatility for smaller retail traders.
- Resolution Criteria: Each Polymarket market has a specific ruleset defining “control” or “invasion,” which determines whether diplomatic agreements or solely kinetic military action triggers a payout.
The Polymarket Greenland ecosystem relies on an automated market maker (AMM) model, ensuring that trades can be executed even without a direct counterparty for every transaction. This structure allows the Polymarket Greenland odds to adjust instantly to new information, making it a real-time barometer of geopolitical risk.
Geopolitical Context and Market Comparisons
The interest in Polymarket is not an isolated phenomenon but part of a wider sector of prediction markets focusing on U.S. foreign policy. Traders often correlate movements in Polymarket Greenland with other high-profile geopolitical markets to identify trends in administration strategy.
To provide context, it is useful to compare the Polymarket Greenland market with the recent betting markets concerning the U.S. operation in Venezuela (the capture of Maduro).
Comparison: Polymarket Greenland vs. Maduro Venezuela Markets
| Feature | Polymarket Greenland Market | Maduro Venezuela Market |
| Primary Driver | Long-term strategic acquisition and resource security rhetoric. | Immediate military intelligence and rapid operational developments. |
| Market Pace | Slow-moving volatility driven by diplomatic statements and summits. | High-frequency volatility driven by breaking news and troop movements. |
| Resolution Source | Official treaties, sales agreements, or declarations of territorial transfer. | Visual confirmation of capture or official Department of Defense statements. |
| Risk Factors | Diplomatic stalemates resulting in a “No” resolution due to time expiry. | Misinformation and “fog of war” causing false price spikes. |
| Correlation | Correlates with Arctic resource news and trade route discussions. | Correlates with regional stability indices in South America. |
While the Venezuela market resolved quickly due to kinetic action, the Polymarket Greenland market remains open-ended, functioning more like a futures contract on U.S. expansionism.
Strategic Geography: Map of Greenland and Canada
A primary tool for bettors analyzing this market is a detailed map of greenland and canada. This geographic visualization highlights the strategic necessity of the island for North American defense. A map of greenland and canada illustrates the proximity of Greenland to the Canadian Arctic Archipelago, emphasizing its role as a buffer zone.
When analyzing a map of greenland and canada, traders often look for specific strategic choke points and infrastructure locations:
- Thule Air Base: Located in the northwest, visible on any map of greenland and canada, this U.S. Space Force base is a critical asset that effectively anchors U.S. presence in the region.
- The GIUK Gap: A map of greenland and canada often extends to show the naval transit lanes that submarines must traverse to enter the Atlantic, making the territory vital for anti-submarine warfare.
- Maritime Borders: The shared maritime boundaries shown on a map of greenland and canada dictate exclusive economic zones (EEZs), which are central to disputes over resource rights.
The map of greenland and canada confirms that control of the island is integral to the broader concept of “Fortress North America.” Consequently, whenever new defense cooperation agreements involving the territories shown on the map of greenland and canada are announced, the “Yes” odds on prediction markets tend to react.
Territorial Scale: Greenland Size vs US
A frequent point of analysis in prediction markets is the logistical feasibility of an occupation, which requires examining the greenland size vs us landmass. The greenland size vs us comparison reveals that while Greenland appears massive on many projections, its habitable area is limited, though its total area is substantial.
Key data points regarding greenland size vs us that influence betting strategies include:
- Total Land Area: The greenland size vs us metric shows Greenland is approximately 836,000 square miles, roughly one-quarter the size of the contiguous United States.
- Coastline Logistics: When comparing greenland size vs us coastlines, Greenland possesses a vast, rugged perimeter that is difficult to patrol or blockade entirely without significant naval resources.
- Population Density: The greenland size vs us population comparison is stark; Greenland has roughly 57,000 residents spread across a massive area, creating a unique “high terrain, low population” dynamic for any potential military operation.
Traders arguing for the “No” outcome often cite the greenland size vs us logistics as a deterrent, suggesting that the cost of securing such a vast territory outweighs the benefits. Conversely, “Yes” bettors argue that the greenland size vs us strategic depth is exactly why the territory is being targeted.
Comparative Analysis: How Big is Greenland Compared to US
To further refine the probability of an acquisition, one must ask: how big is greenland compared to us in terms of administrative capacity? The answer to how big is greenland compared to us dictates the level of federal investment required post-acquisition.
Factors regarding how big is greenland compared to us include:
- Infrastructure Deficits: The answer to how big is greenland compared to us highlights a lack of interconnecting roads in Greenland, requiring a massive infrastructure build-out comparable to the construction of the U.S. Interstate system in scope but in an Arctic environment.
- Resource Management: Understanding how big is greenland compared to us helps estimate the potential mineral yield; the territory represents a landmass capable of supplying rare earth elements at a scale similar to major U.S. mining states like Nevada or Arizona.
- Surveillance Coverage: The question of how big is greenland compared to us is relevant for radar coverage; securing the airspace requires a sensor network that spans a distance comparable to the entire U.S. East Coast.
Investors use the answer to how big is greenland compared to us to model the budgetary impact of a purchase or invasion. If the fiscal cost is projected to be too high, the probability of the event—and thus the Polymarket Greenland price—may decline.
Economic and Social Metrics: Greenland Compared to US
Beyond physical size, analyzing greenland compared to us in terms of economics and demographics provides insight into the friction points of a potential annexation. Greenland compared to us presents two vastly different economic models that would need to be integrated.
Relevant comparisons for greenland compared to us include:
- GDP and Subsidy Dependence: Greenland compared to us has a micro-economy heavily reliant on the “Block Grant” from Denmark, whereas the U.S. economy is diversified and self-sustaining, suggesting an immediate financial burden on the U.S. Treasury.
- Political Structure: Greenland compared to us operates as a parliamentary democracy with strong indigenous Inuit governance, contrasting with the U.S. federal republic system, which could lead to protracted legal battles affecting the timeline of control.
- Climate Adaptation: Greenland compared to us faces immediate and drastic climate change impacts, altering the viability of ports and airfields faster than in most U.S. states.
The stark differences in greenland compared to us suggest that a “hostile” takeover would meet significant local resistance. Bettors monitoring greenland compared to us socio-political indicators often view local protests or statements from the Greenlandic Premier as “sell” signals for acquisition contracts.
The Economic Driver: Greenland Anorthosite Mining Construction
A significant variable driving the “Yes” sentiment in prediction markets is the sector of greenland anorthosite mining construction. Anorthosite is a mineral critical for the production of aluminum and fiberglass, and Greenland holds some of the world’s largest deposits. The development of greenland anorthosite mining construction projects is viewed as a strategic imperative for reducing U.S. reliance on foreign supply chains.
Traders watch for specific developments in greenland anorthosite mining construction:
- Permit Issuances: News regarding new permits for greenland anorthosite mining construction issued to Western companies often correlates with a rise in the probability of U.S. economic integration.
- Infrastructure Investment: Announcements of U.S. funding for greenland anorthosite mining construction roads or ports signal a “soft power” approach to control, which might precede formal acquisition.
- Strategic Partnerships: Joint ventures in greenland anorthosite mining construction between U.S. firms and local Greenlandic entities serve as proxies for political influence.
If the greenland anorthosite mining construction sector accelerates, it increases the asset value of the territory. Consequently, the greenland anorthosite mining construction keyword is frequently tracked by algorithms trading on the Polymarket Greenland market, as it represents the tangible economic prize behind the geopolitical posturing.
Environmental Factors: Greenland Northern Lights
While hard power dictates military odds, the greenland northern lights and the associated environmental conditions play a role in the logistical timing of any potential operation. The greenland northern lights are visible primarily during the winter months, which coincides with the harshest weather conditions in the Arctic.
The impact of the greenland northern lights season on betting markets includes:
- Operational Windows: The visibility of the greenland northern lights indicates the dark season, a period where large-scale military logistics or construction projects face maximum difficulty, potentially lowering the probability of immediate action during these months.
- Tourism Economy: The greenland northern lights are a centerpiece of the local tourism industry. Disruption to this sector due to geopolitical tension could cause economic backlash, a factor considered by bettors analyzing the political cost of intervention.
- Atmospheric Interference: The geomagnetic activity that causes the greenland northern lights can interfere with communications. Military strategists—and by extension, sophisticated bettors—consider the solar cycle and the intensity of the greenland northern lights when predicting the timing of high-tech operations.
The greenland northern lights serve as a reminder of the extreme environmental variables at play. For a prediction market expiring in the winter, the presence of the greenland northern lights signifies a period where diplomatic maneuvering is more likely than boots-on-the-ground escalation.
Strategic Naval Context: Map of Iceland and Greenland
To fully assess the naval strategy underpinning these bets, one must consult a map of iceland and greenland. These two nations form the northern barrier of the North Atlantic. A map of iceland and greenland illustrates the “GIUK Gap,” a naval choke point essential for monitoring Russian naval movements.
Insights derived from a map of iceland and greenland include:
- Base Redundancy: A map of iceland and greenland shows that the U.S. utilizes Keflavik in Iceland and Thule in Greenland. Securing Greenland permanently ensures that the western pillar of this defense line remains under U.S. control regardless of political shifts in Iceland.
- Submarine Warfare: The deep-water channels visible on a map of iceland and greenland are the primary transit routes for nuclear submarines. Control of the coastline shown on the map of iceland and greenland is critical for acoustic monitoring networks.
- Diplomatic Linkage: A map of iceland and greenland highlights their geographic isolation from mainland Europe. This shared isolation often leads to aligned diplomatic stances, meaning U.S. pressure on Greenland could result in diplomatic friction with Iceland.
Traders utilize the map of iceland and greenland to visualize the theater of operations. Any increase in naval patrols reported in the waters depicted on the map of iceland and greenland is typically interpreted as a leading indicator for increased tension, driving volume to the Polymarket Greenland market.
Risks and Trading Strategy
Participating in Polymarket Greenland markets involves significant financial risk. The markets are highly speculative and subject to rapid reversals based on single news events.
Key Risk Factors:
- Regulatory Action: The CFTC has actively targeted event contracts. Access to Polymarket Greenland markets may be restricted for certain users, or the platform could face enforcement actions that disrupt trading.
- Ambiguous Resolution: Diplomatic deals often occupy a gray area. A “lease” or “partnership” might not qualify as “control” or “purchase” under the strict wording of the Polymarket Greenland contract, leading to disputes.
- Capital Lockup: Geopolitical events can take years to materialize. Capital allocated to a long-term Polymarket Greenland position is illiquid, meaning traders miss out on other opportunities while waiting for a resolution.
Strategic Considerations:
- Hedging: Traders may use Polymarket Greenland contracts to hedge against broader market volatility. If a U.S. acquisition attempt triggers a global market sell-off, a “Yes” position on the prediction market could offset equity losses.
- Information Arbitrage: Successful traders often react to niche news sources—such as Danish foreign ministry reports or greenland anorthosite mining construction filings—before the information hits mainstream U.S. media outlets.
Final Thoughts
The Polymarket Greenland market serves as a financial instrument for quantifying the probability of a major shift in Arctic sovereignty. It reflects a convergence of strategic military interests, resource economics, and diplomatic maneuvering.
For the observer or trader, the Polymarket data points, ranging from the logistical realities shown on a map of greenland and canada to the economic potential of greenland anorthosite mining construction, provide a framework for understanding the complexities of 21st-century geopolitics.
Whether the outcome is a historic acquisition or a continuation of the status quo, the market provides a real-time probability score for one of the most ambitious potential territorial expansions in modern history, similar to many other controversial bets that the website makes available for betting.
Frequently Asked Questions
How is the “Yes” outcome defined in the Polymarket Greenland contract? Each market has specific rules, but generally, a “Yes” resolution requires irrefutable evidence of a transfer of sovereignty, a completed purchase agreement, or a recognized military occupation by the United States within the contract’s timeframe.
What is the correlation between mining and the betting odds? There is a positive correlation. News regarding the expansion of greenland anorthosite mining construction often leads to an increase in “Yes” odds, as it aligns with the economic incentives for a U.S. acquisition.
How does the geography affect the likelihood of invasion? The greenland size vs us comparison suggests that a full hostile occupation is logistically improbable. This reality often keeps the “Yes” probability lower than it might be for a smaller, more accessible territory.
Why do traders look at a map of Iceland and Greenland together? They are viewed as a single strategic unit (the GIUK Gap). A map of iceland and greenland reveals the naval chokepoints that the U.S. seeks to control, explaining the strategic value behind the bet.
Does the winter season affect the betting market? Yes. The greenland northern lights season (winter) presents harsh conditions that typically discourage major military or construction operations, potentially suppressing “Yes” volatility during these months.
Is Polymarket the only place to bet on this? While Polymarket Greenland markets are the most prominent in the crypto space, regulated exchanges like Kalshi may offer similar contracts regarding U.S. territorial expansion, subject to CFTC oversight.